
The recent Adrenalin Driver release for AMD has been met with acclaim by the press and fans alike. It brought many exciting features and quality of life improvements to the driver stack and thus makes life for Radeon users more exciting and feature-rich. One of the most outstanding, user-facing features is the Radeon Overlay.
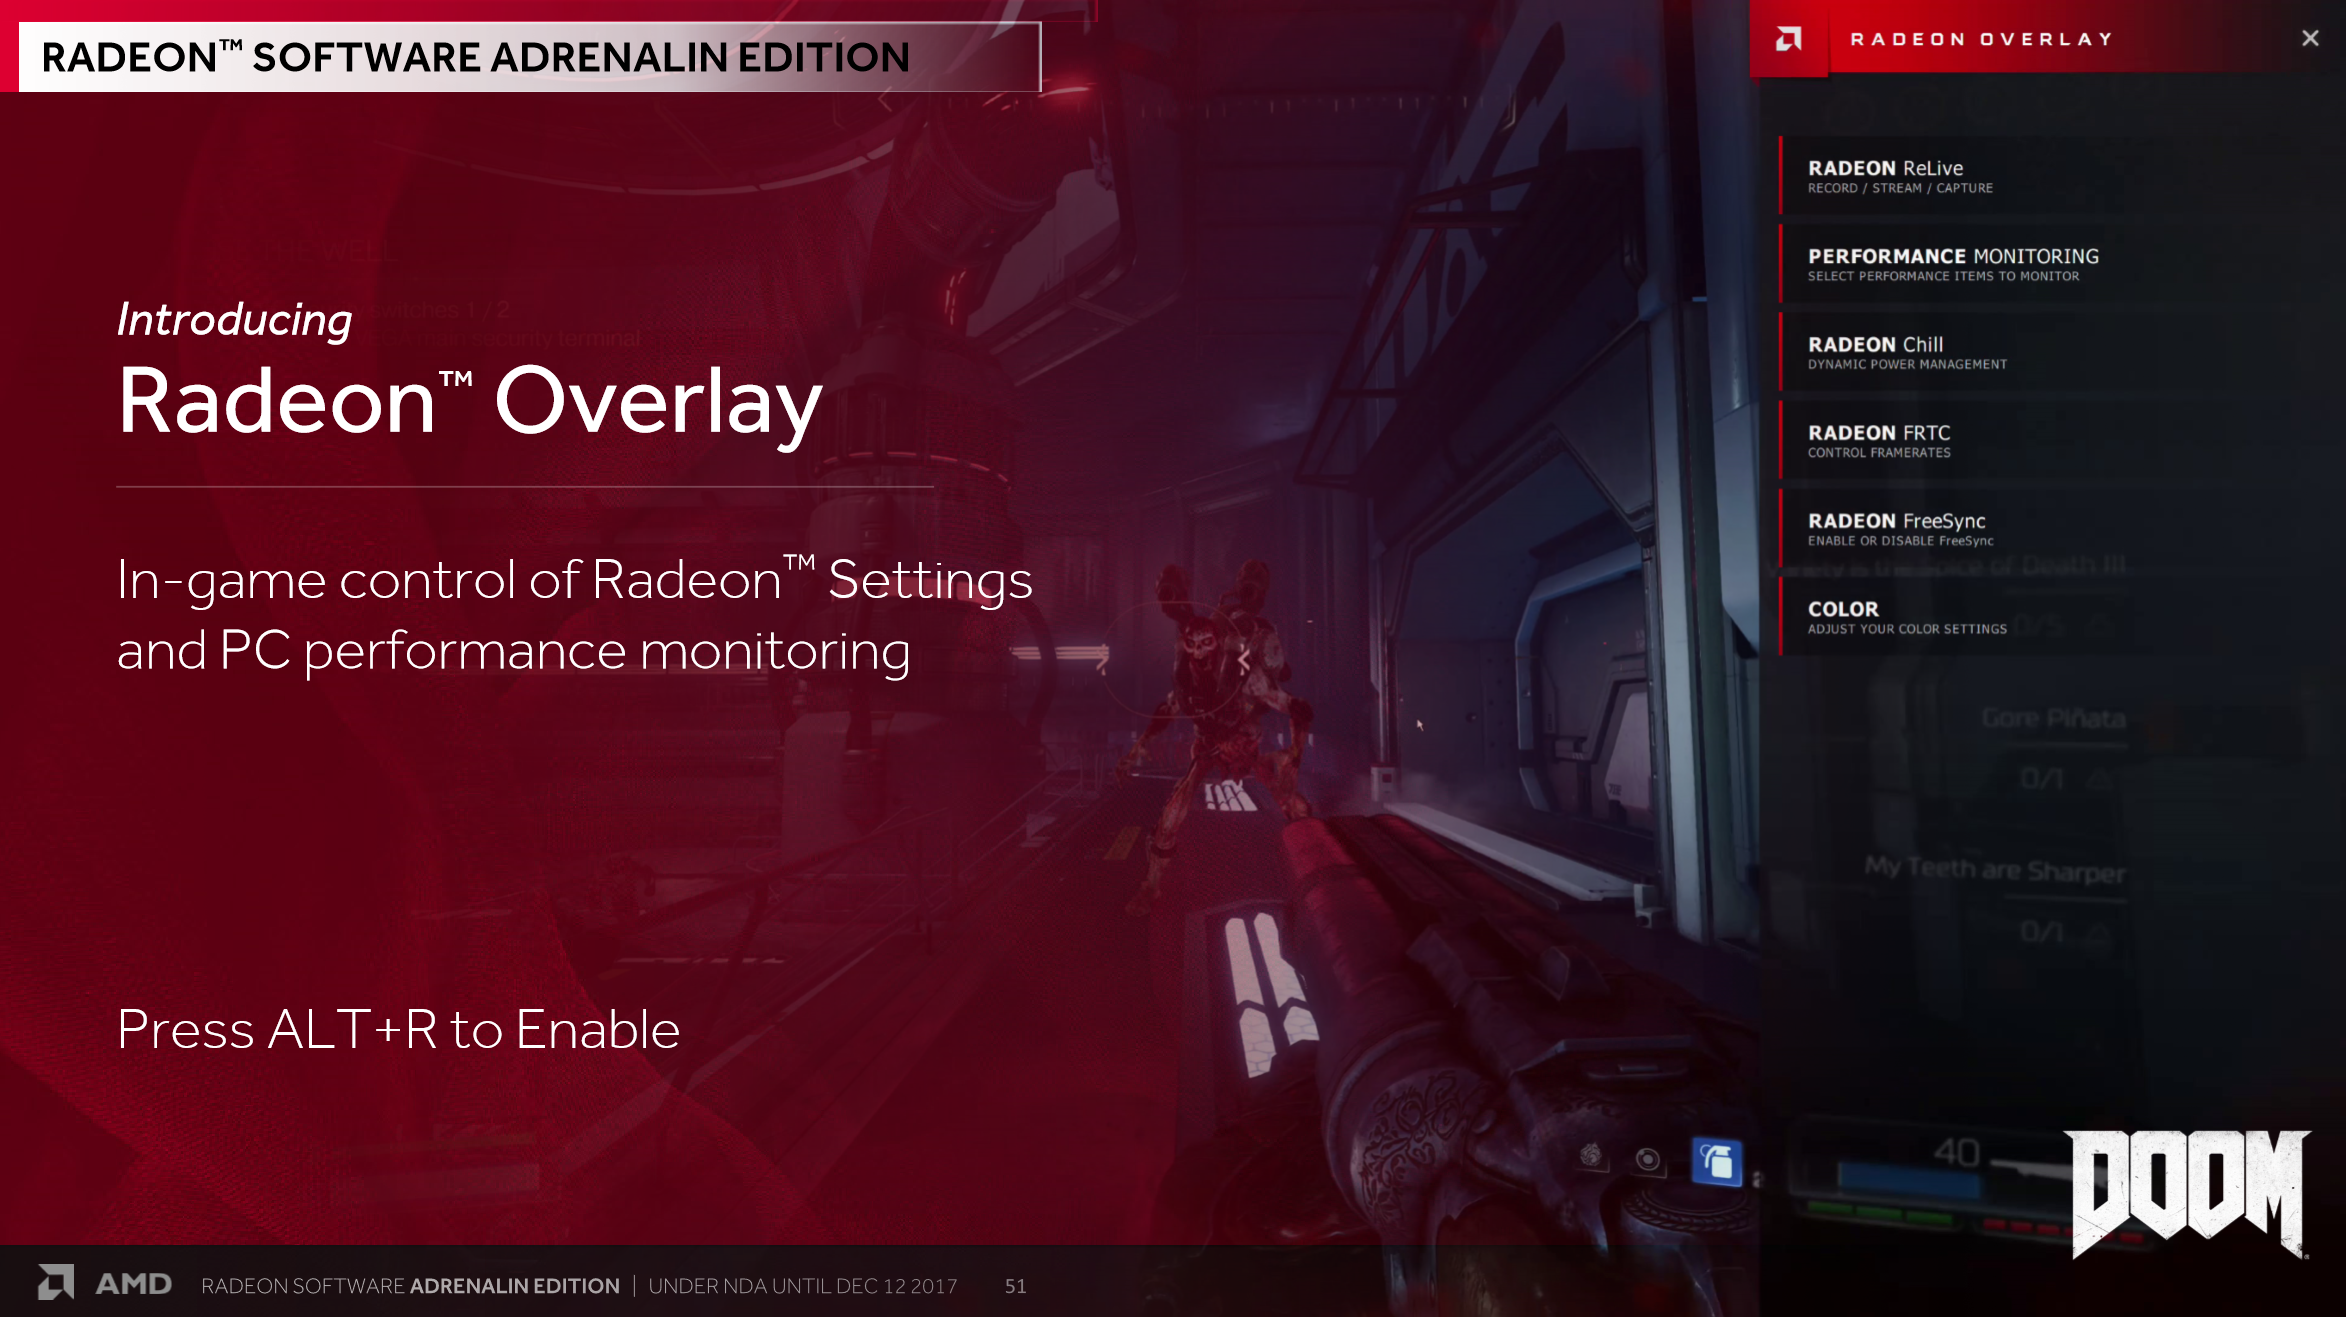
Introducing the Radeon Overlay!
The Radeon Overlay is an easy-to-use control menu for most of the features the AMD Adrenalin offers. Here’s a video showcasing it in action!
How to turn the Radeon Overlay on:
While in game, by default press ALT+R.
What you can see via Radeon Overlay in-game:
Radeon ReLive – This tab allows the user to control their ReLive experience. Stream, record, take pictures and set the perfect user experience whilst in-game!
Performance Monitoring – We’ll go in-depth on this one later in the article!
Radeon Chill – A very useful feature that allows users to save power and even lower input latency with very careful limiting of framerates, though only whilst the user is inactive. A dedicated article showing the myriad of ways this can help our users is on its way! Look out for it soon!
Radeon FRTCS – This is like a simpler version of Chill. It just limits the maximum frame rate of certain titles and can save power or, when combined with FreeSync, make for a better and more fluid experience in some games.
FreeSync – Manual control FreeSync in case you need to turn it on or off whilst in game.
Color – Adjust color settings like saturation or contrast and others whilst in game. It can also be useful for reading and movies!
*Note: Radeon Chill and Performance Monitoring are in-game only. They cannot be accessed in the desktop.
Now, at the center of today’s article are the features and use cases of the Performance Monitoring tab!
Performance Monitoring:
When players click on this part of the overlay, they are treated to three sub-menus.
Metrics options
Players can configure their tool for ease of use. Here are the current in-overlay settings and what they do!
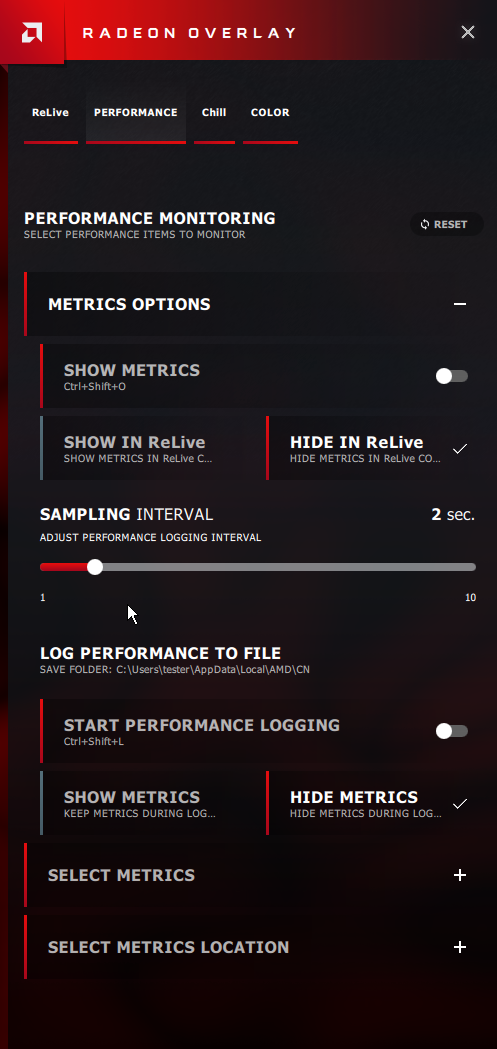
Show Metrics – Simply enables or disables Metrics.
Show in ReLive/Hide in ReLive – Very much self-explanatory. You can choose whether to show or hide these metrics whilst streaming or recording video.
Sampling Interval – Adjusts performance logging, allowing users to modify how often information is refreshed onto the Log File.
Log Performance to file – Where information is logged to. The default is C:\Users\tester\AppData\Local\AMD\CN
Start performance logging – Starts the logging process. Collects data in the specified location. Great for benchmarking performance!
Show Metric/Hide Metrics – Choose whether to show the Metrics during a logging session.
Select Metrics
Here are the possible elements we can monitor and why information about them may be important:
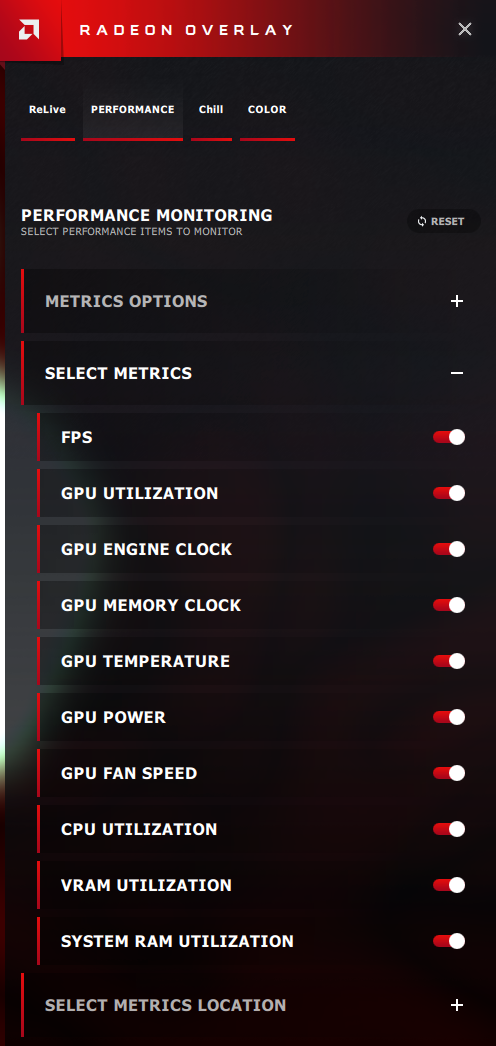
FPS – Number of frames per second. The standard in measuring performance in games. The more, the better, usually. Seeing the FPS can help people configure their settings to get a good experience.
GPU Utilization – Reported as a percentage (%), it shows the usage of the video processor in 3D/2D situations, and can be used to locate bottlenecks within the system. Generally, high usage shows a well-balanced system in which the CPU manages to fully feed the GPU. A note of caution, however: 99/100% utilization doesn’t preclude a CPU bottleneck, and may still mean the GPU isn’t perfectly well fed in some cases. Still, as a general tool, it is more than good enough.
GPU Engine Clock – Reported in megahertz (MHz), it shows the GPU’s Shader clock. For example, on a Sapphire R9 Fury Nitro OC+, it would be 1050 mhz. This can be useful during overclocks, ensuring they stick. It can also help you see whether the GPU cooling is good enough to hold the clocks consistently. That said, in newer GPUs, some leeway and clock movement is to be expected.
GPU Memory Clock – Reported in megahertz (MHz), this is the same information the previous clock presents, but for the memory. For example, on an RX Vega 64 Nitro+, it would be 945 mhz. It can also show whether overclocks to the memory stick or monitor power states. Fluctuations here in a high 3D Game load are not very normal with current GPUs, unlike with the Engine clock.
GPU Temperature – Reported in celsius, this one is very helpful with cooling, monitoring your system and overclocks. Remember, the cooler the GPU, the happier and more efficient it is! How cool it is by default or should be varies from GPU to GPU as well as cooler or PCB. Still, the 60s are great and low to mid 70s for high-end GPUs are very good on air-cooling!
GPU Power – Reported in Watts, GPU power is a software calculation of how much power your video card is using. It’s useful for tracking efficiency, but do take care — whilst very good for any consumer, the calculation is not as exact as what specialized equipment can get. Take its readings with a grain of salt. It is quite accurate, but not completely so.
GPU Fan Speed – Reported in revolutions per minute (RPM). Along with GPU power and temperature as well as the clocks, it can be key for extracting the most out of your product, which will normally waver and vary by default. Play with all the above-mentioned variables to extract the maximum performance for the best possible noise levels!
VRAM Utilization – Reported in gigabytes (GB), this one shows the total number of VRAM allocated at any one moment. This can be essential information for people tuning the best settings in, but beware — VRAM allocation is a complex topic. Almost all games actually request more memory than they really need for little real-world gain. It is entirely possible for a game to have requested 5 GB of VRAM but actually do perfectly fine with 4GB, the actual amount used. In addition, Windows and other possible programs request some memory as well. Still, once you are armed with knowledge of those caveats, the function can be very useful!
CPU Utilization – Reported as a percentage (%), it’s actually a lot like the GPU utilization. Again, whilst very useful, it should also be taken with a grain of salt. Multi-core systems will likely see lower utilization in games, especially old ones, but that does not mean the CPU or GPU is at fault. Old software tends to be poorly multi-threaded. The system also uses up CPU resources—to an even greater extent than GPU ones. Finally, just because a CPU is, say, 70-80% utilized, it does not mean that a faster or higher core count processor will boost performance. Things are much more complex here, but this performance tab can help an enthusiast for sure.
System RAM Utilization – Reported in gigabytes (GB), it’s similar to the VRAM tab, except it shows total system memory. Do note that your operating system and programs can and do use some RAM as well. Bear in mind that games also tend to request more RAM than they really need.
Select Metrics Location – Choose the placement of the Performance Monitoring data. The options are:
- Top left corner of display
- Top right corner of display
- Bottom left corner of display
- Bottom right corner of display

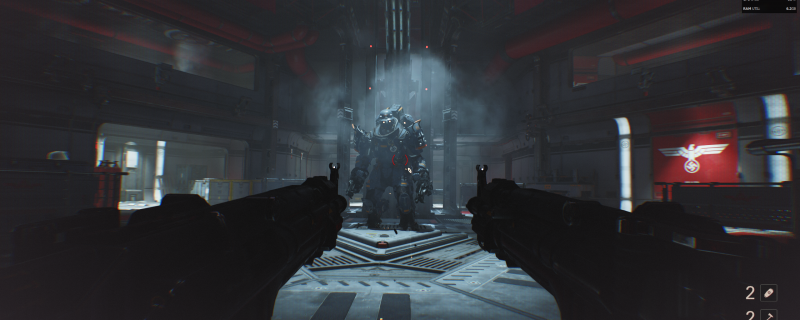
Overlay in top right corner with some of the metrics enabled in Wolfenstein 2!
The Radeon Overlay is a massive asset for enthusiasts, streamers, content creators and pure gamers alike. It has features for everyone, even in its first iteration! Do note, however, that whilst very feature rich, some options are still only present within the AMD Radeon Settings application.
The Performance Monitoring tab within the overlay can be a godsend to many gamers, provided they are armed with knowledge on the intricacies of PC hardware.